AI Insights Assistant
AI Insights Assistant - User Guide
1. Introduction 📝
AI Insights is a next-generation data exploration tool that allows you to talk to your ERP data in plain English. Instead of navigating complex menus or building manual reports, you can simply ask questions like “What was my sales growth last month?” or “Show me top 5 slow-moving items.” The AI assistant instantly translates your request into a data table and a visual chart.
Key Objectives of AI Insights:
- Frictionless Reporting: Get answers instantly without technical expertise.
- Visual Discovery: Automatically convert raw numbers into Bar, Line, and Donut charts.
- Authorized Access: Ensure sensitive data stays protected through role-based category filtering.
2. Interface Walkthrough 🏗️
Accessing the Module
To access the AI Insights Assistant, navigate to System Tools > Other Masters > AI Insights from the main menu.
The AI Assistant Interface
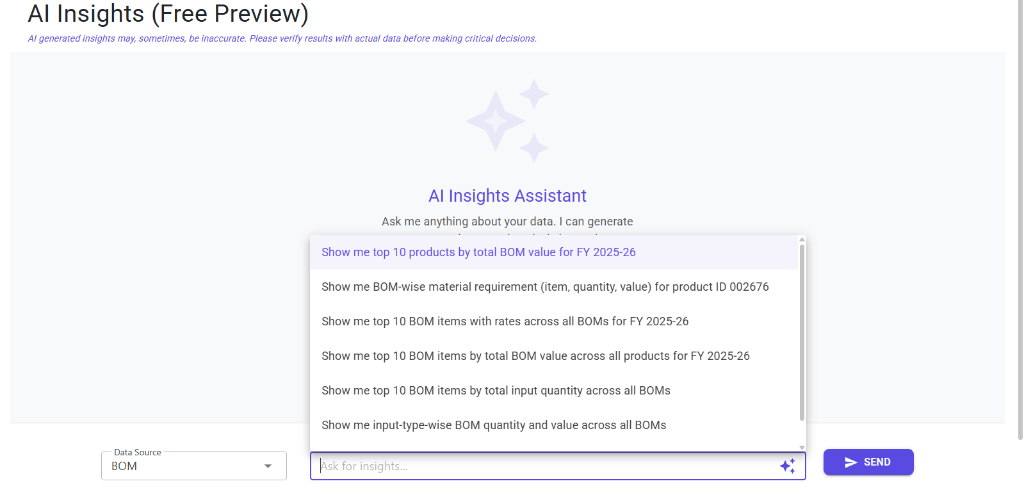
The AI Insights dashboard is designed to be as simple as a search engine. Its key components include:
- Data Source Selection: A dropdown to specify which “brain” the AI should use (e.g., BOM, Sales, Inventory).
- Conversational Input: An interactive search bar where you can type your questions in plain English.
- Suggested Prompts: As you start typing, the system provides a list of pre-configured questions to guide your analysis.
- Global Send: A dedicated button to submit your request and generate the insight.
3. How it Works (The Prompt System) 🏗️
The system organizes its “knowledge” into Data Sources (Categories).
A. Data Categories
Before asking a question, you select a category (e.g., Sales Analysis, Inventory Trends, Financial Summaries). This tells the AI which part of the database to look at.
- Note: You will only see categories that your user role is authorized to access.
B. Suggested Prompts
To help you get started, the system provides Suggested Prompts via the autocomplete search bar. These are pre-tested questions that provide high-value insights.
4. Visualizations & Charts 📊
AI Insights doesn’t just show you rows of data; it brings data to life with interactive charts powered by Chart.js:
- Bar Charts: Best for comparing different items (e.g., Sales by Salesman).
- Line Charts: Perfect for spotting trends over time (e.g., Monthly Revenue Growth).
- Donut Charts: Ideal for seeing parts of a whole (e.g., Expense Breakdown).
5. Features & Actions 📥
Once the AI generates an insight, you have several tools at your disposal:
- Export to Excel: Click the Excel icon to download the raw data in a spreadsheet for further manual analysis.
- Download Chart: Click the Image icon to save the chart as a
.pngfile for your presentations or emails. - Chat History: The system maintains your session history, allowing you to scroll back and see previous insights you generated in the same session.
6. Usage Constraints & Credits 🛡️
🪙 Credit System
AI Insights operates on a “Credit” model. Every time the AI successfully generates a new insight, a credit is deducted from your company’s balance.
- If your balance reaches zero, the “Send” button will be disabled.
- Contact your System Administrator to top up credits.
✅ Accuracy Disclaimer
While the AI is highly advanced, it can occasionally misinterpret a complex request. Always verify critical financial insights against the official “Core Reports” before making major business decisions.
7. Common Troubleshooting 🔍
“No Data Found”
- Possible Cause: Your query was too specific or referenced items/dates that don’t exist in the database.
- Solution: Try a broader prompt or one of the “Suggested Prompts” for that category.
“Please Contact System Administrator”
- Possible Cause: The AI Insights feature is not enabled for your database, or your user role lacks the necessary permissions.
“Credits Exhausted”
- Possible Cause: Your company has reached its monthly AI usage limit.
8. Best Practices 💡
- Start with Suggestions: Use the autocomplete suggestions to understand how to phrase your own custom questions.
- Specify Timeframes: Include dates in your prompts (e.g., “in the last 30 days” or “for the year 2024”) for more accurate results.
- Review Column Headers: Interactive tables allow you to see the exact field names used by the AI—this can help you refine your next question.